The inline inspection dashboard will change the way inspection data of pipelines is going to be received and used by water utilities all over the world. It’s an online map in which the pipeline is centred and it visualizes exactly what you want to know in regard to localizing degradation levels, wall thickness degradation, ovality, angular rotation and deformation of your water pipeline or rising main. Making investment decisions related to aging pipelines is becoming easier and more accessible than ever.
The inline inspection dashboard is an interactive (inspection) data viewer in which the pipeline is centred. It maps out the spots in and on the pipeline that are assessed by inline inspection and highlights the spots that need to be looked at and/or are potentially troublesome. This dashboard shows you, by means of colours and labels, which parts of the examined pipe are compromised. This is done by mapping out degradation levels, wall thickness degradation, ovality, angular rotation and deformation. The inline inspection dashboard will tell you what is going on at every individual segment of the pipe inspected, and at every joint. It’s a visualisation of all the data gained from the inspection performed by one of our inline inspection tools.
As mentioned, the dashboard looks like a map. On this map you can zoom in on inspected pipelines to get a more detailed view, change filters such as anomalies and change critical thresholds like ovality and angular rotation to the extend you want, to get the most out of your data and get the insights exactly tailored to your needs.
In total, there are three views to choose from: anomalies, joints and pipe segments:
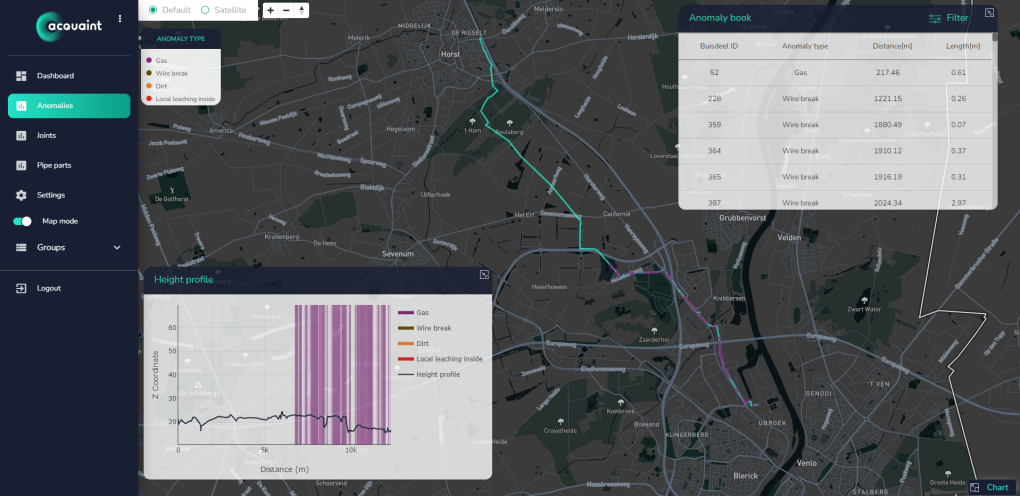
In this view you are able to see what kind of anomalies have been detected at what part of the pipeline. Only the spots where an outlier in data was detected are depicted as spots on the pipeline.
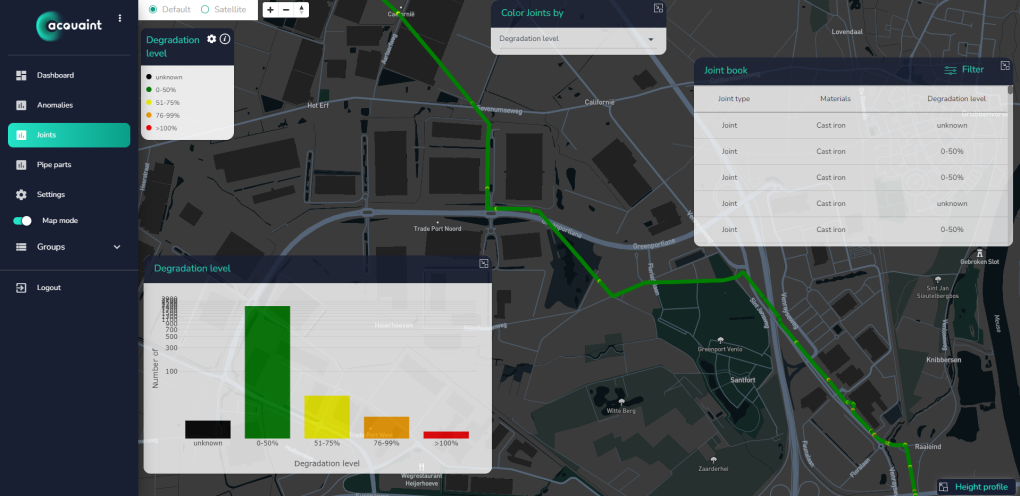
Every joint is visualized as a coloured dot representing a characteristic selected by the user: Material, degradation or gap width for instance.
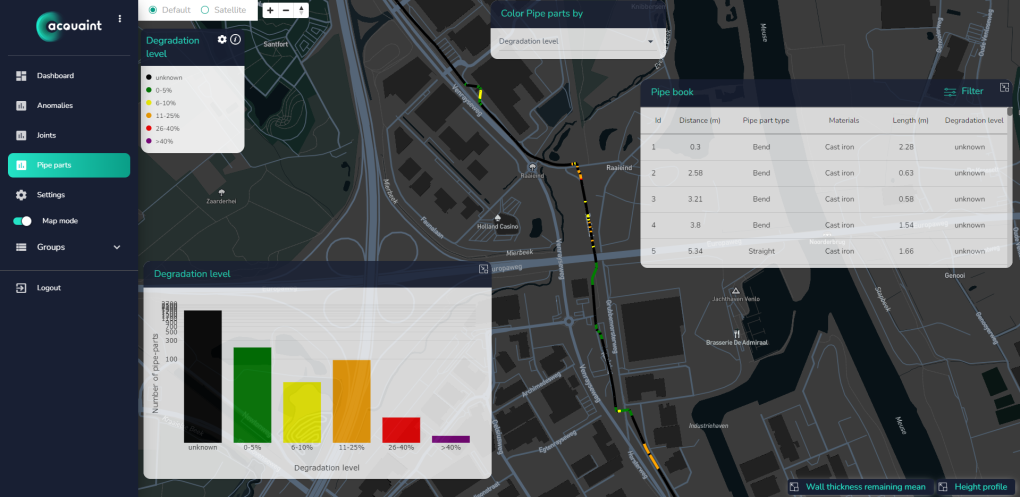
The whole pipeline is broken down into pipe segments. You can check inspection data of every individual part. The dashboard provides some information on every part.
Next to that, the following aspects will be integrated in the dashboard:
Previously, when an inspection was completed and analysed, our clients would receive a detailed inspection report. This will still be the case, however now they are able to interactively, in almost a gaming manner, determine and analyse the state of their pipeline. Even more important, compared to reading an inspection report, through this online dashboard it will be more difficult to misinterpret the information because the information is more organized and visually linked to the specific location of the deviation in or on the pipeline. And lastly, through this cloud interface the inspection data will be available for anyone in the client’s organisation, also people with no GIS experience.
Do you want to try it yourself? Contact us at info@acquaint.eu!


